
Finance guides
Finance Dashboard
Revenue, expenses, net income and what's overdue — the executive money view with 7/30/90-day windows.
Watch: Finance Dashboard in 90 seconds
What it does
The Finance Dashboard is the first place to look each morning: headline cards for revenue, expenses, net income (with margin %) and outstanding invoices (with collection rate), an income-vs-expenditure chart, and the overdue invoices that need chasing — all refreshing automatically every minute.
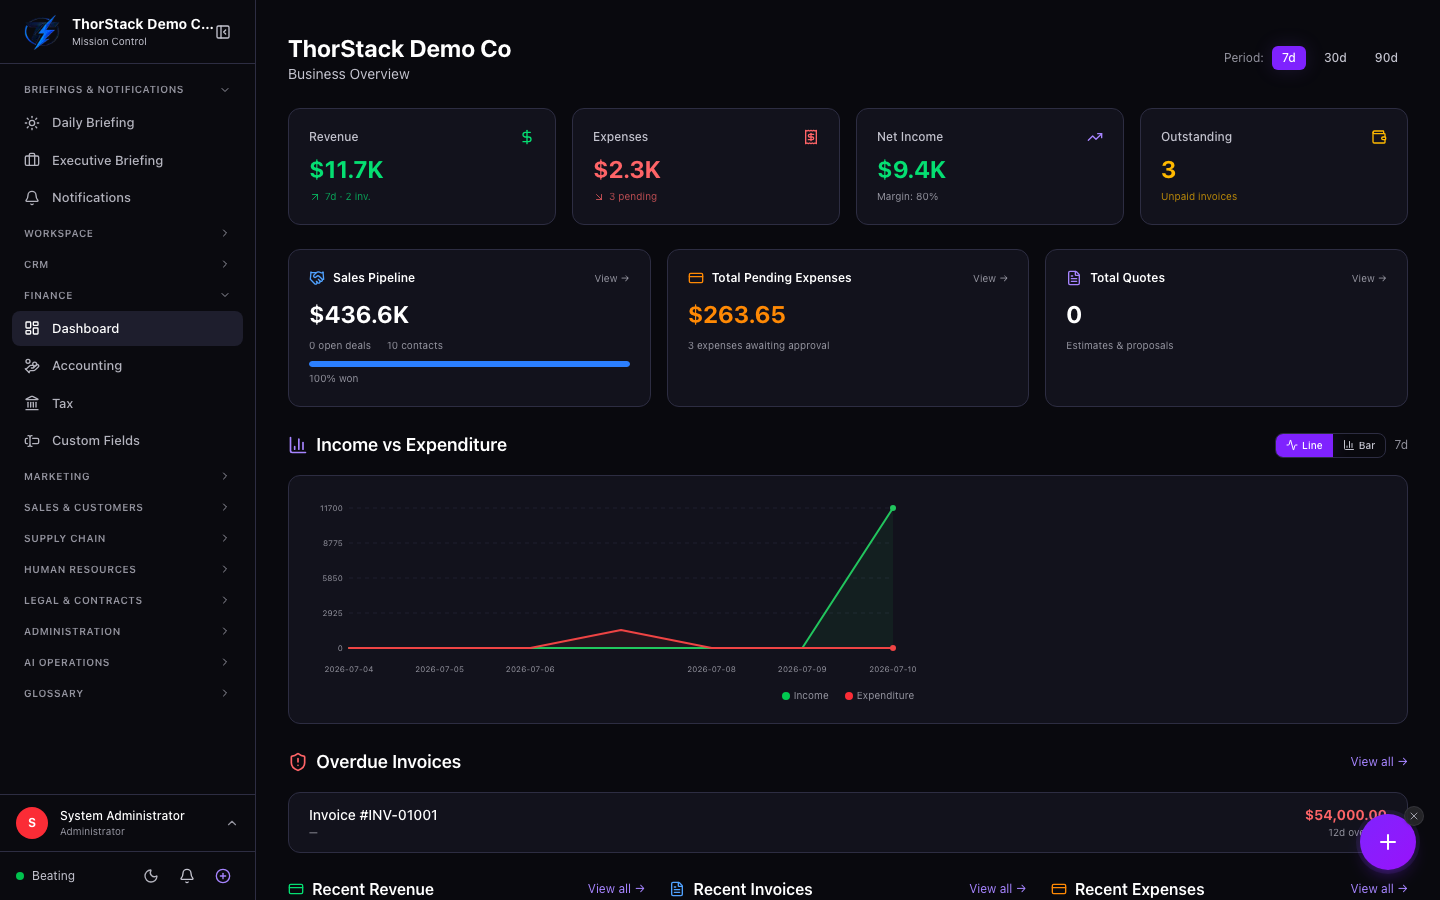 The dashboard
Reading it
| Element | What it tells you |
|---|---|
| Period buttons | 7d / 30d / 90d re-window every number on the page. |
| KPI cards | Each links to its detail page — Revenue → invoices, Expenses → expenses, etc. |
| Income vs Expenditure | Toggle Line / Bar; hover for day-level income and spend. |
| Overdue invoices | Top five, with days overdue — red until dealt with. |
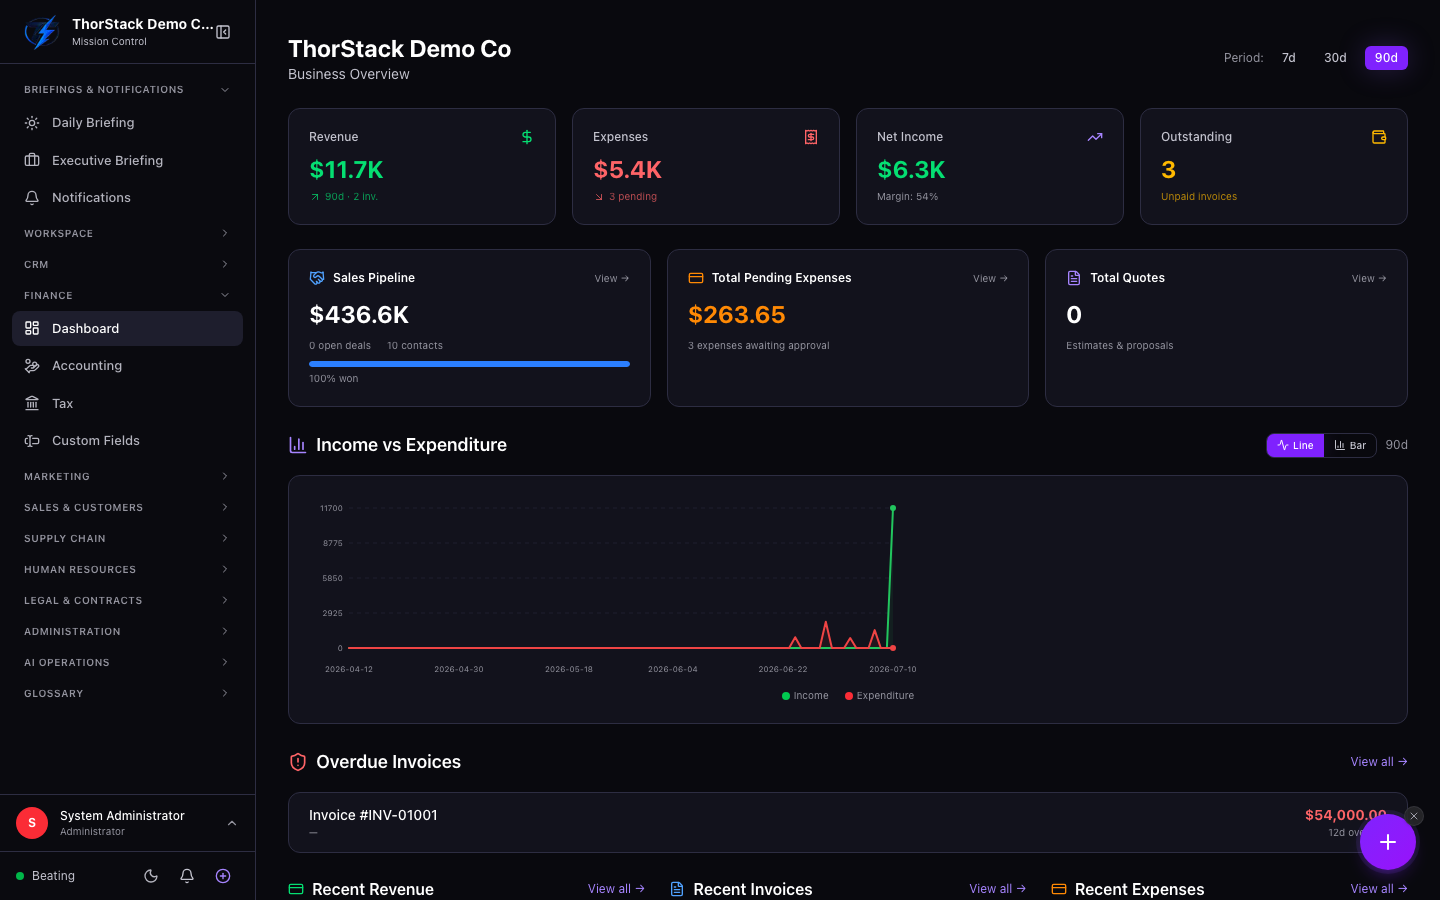 The 90-day window
Beyond the headline
The middle row pulls in context from adjacent modules — the CRM sales pipeline, pending expense approvals and open quotes — and the bottom row lists the most recent payments, invoices and expenses with status badges.
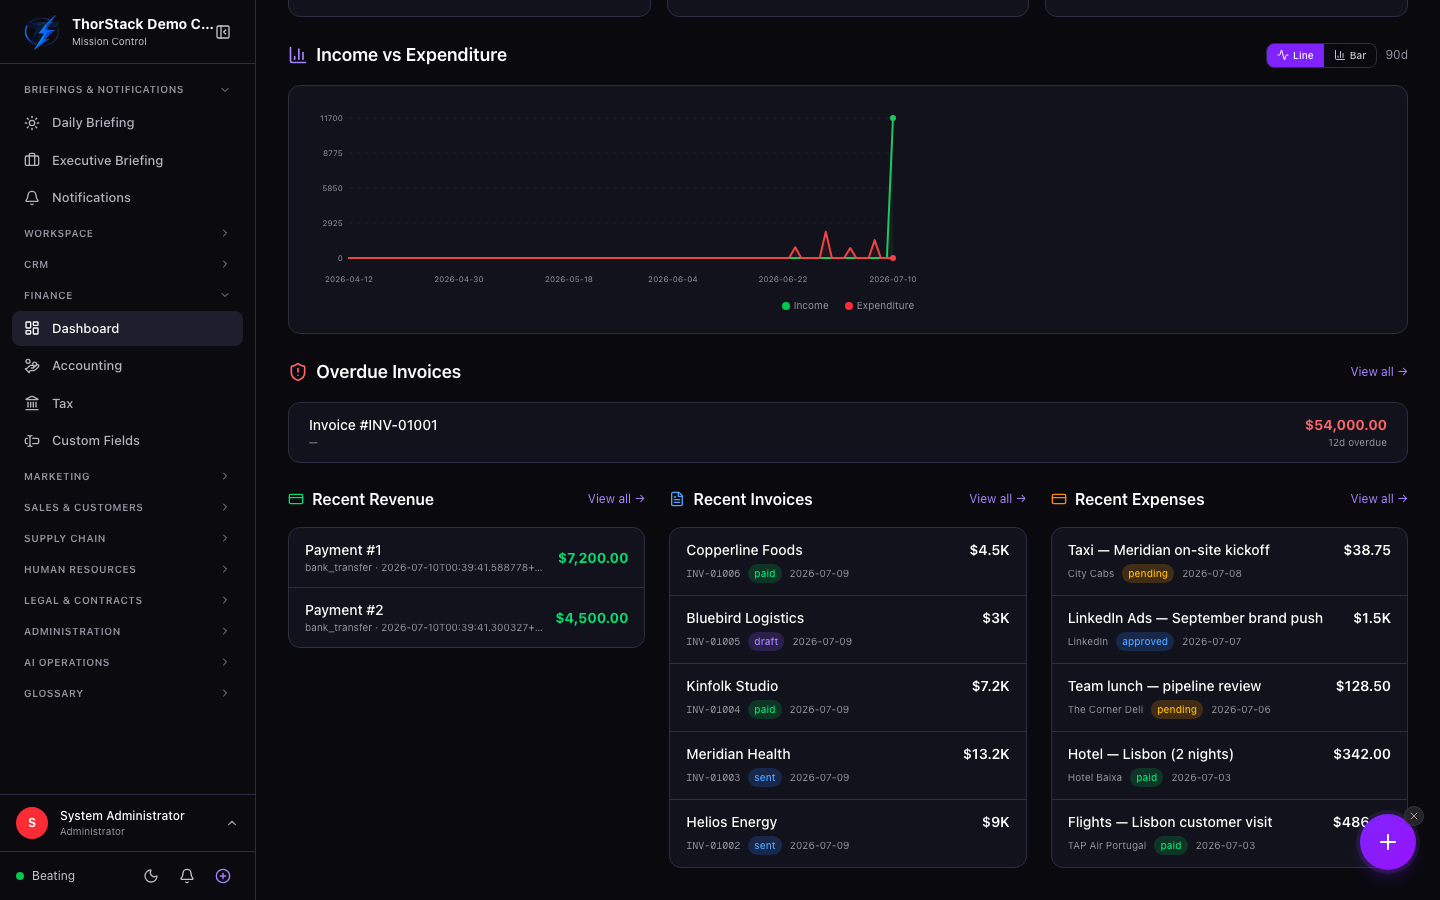 Overdue and recent activity
Related
- Accounting — where every number on this page is managed.
- CRM Analytics — the pipeline card's source of truth.